


Connecting AI was the last era. The new one's here. Join the Waitlist >

AMAZON CUSTOMER LTV COHORT ANALYSIS

Is Your Repeat-Customer Base Getting Healthier?

Answering that well is harder than it sounds. It takes user-level purchase data most sellers can only get through a data clean room like Amazon Marketing Cloud, then multi-layered SQL just to stitch it into something readable, without a data team on call. This is a real cohort LTV dashboard, broken down the way you'd need to see it to know.

A Live Sample of the Same Dashboard

This is a real, interactive cohort LTV dashboard running on sample account data. Click through the metric tabs, scan a cohort's row month by month, and see what the pattern tells you.

How it works

Requesting the report puts you in the queue

We build one with you, on your account data, for free.

  1. 1

    Request the free report

    Enter our queue. We come back with where you sit in it.

  2. 2

    Connect your instance

    Amazon Insights has to be activated in your AMC instance. This one is not optional, and we work with you to confirm it is there.

  3. 3

    Receive the Free report

    A few days later an analyst sends the cohort model and walks you through what it says.

We take a limited number of these each month to ensure seamless onboarding.

Request your free LTV cohort report

Two minutes to fill in. We come back with next steps and where you sit in the queue.

Required: Amazon Insights data activated in your AMC instance. Without it there is no repeat purchase signal, and no cohorts to build.

We confirm the data access scope with you in writing before anything runs. Nothing is queried from your AMC instance until you say go.

4 Questions This Dashboard Answers

4 Questions This Dashboard Answers

Is retention improving or slipping month to month?

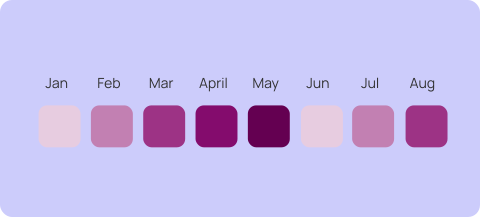
Read a single cohort's row left to right and watch the trend. If your catalog is seasonal, you'll see those ripples in the month-to-month scan too.

Compare cohort to cohort to see whether last month's dip is a blip or the start of a slide.

Every metric (units, orders, GMV, repeat rate) tells a slightly different part of the story.

Did that remarketing campaign move retention?

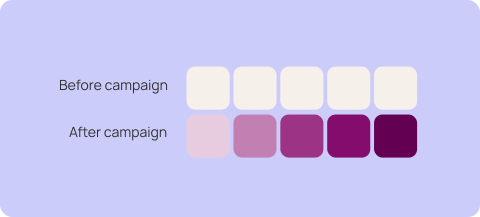
Line up the cohorts before and after a campaign launch and compare their curves directly.

Isolate the one metric the campaign was meant to move, instead of reading it off a blended total.

Watch the effect compound: a few extra points of month-1 retention shows up in the Month 6 and Month 9 checkpoints too.

Did the loss-leader strategy pay off in category LTV?

Trace a pricing decision through to the LTV checkpoint cards, not just this month's margin line.

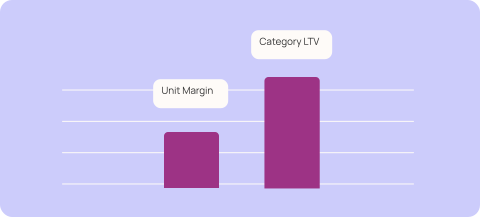
Weigh a thinner unit margin on the loss leader against the lifetime value it's buying you back.

Bring your boss the cohort, not just a hunch.

What's each product's true break-even ACoS?

Every ACoS target set from first-order margin prices a customer at their first order. The first order is the only one you paid to acquire.

Read the ceiling off the Month 6 checkpoint instead: that's your true break-even ACoS, per product, not per account.

Separate SKUs that build a repeat base from SKUs that just move units. Two products with identical monthly revenue can deserve completely different spend.

Frequently Asked Questions

Frequently Asked Questions

A cohort is every unique Amazon shopper grouped by the calendar month of their first-ever purchase from the brand, their NTB (new-to-brand) month. From there, we track that same group's purchases in every calendar month afterward, cumulatively, to see how lifetime value from that cohort compounds over time.

Anyone who placed a second order after their first, within the tracked window. That's what the Repeat Customers and Retention columns in the Cohort Summary table are counting: not returning visitors, not repeat sessions, actual second purchases.

Cumulative average orders, units, or GMV per customer in a cohort, tracked out to 12 months from their first order. The LTV Checkpoint cards (First Order, Month 3, Month 6, Month 9) blend that same math across every cohort that's reached each milestone, so you get one comparable number instead of thirteen separate rows to eyeball.

Customer lifetime value is the total revenue the average customer generates across every order they place with your brand, not just their first. On Amazon it's typically measured over a 12-month window, since that's the practical lookback available through Amazon Marketing Cloud. The reason it matters: your acquisition cost is spent once, on the first order. Every order after that arrives without it. A product whose average customer orders three times in a year can profitably carry a much higher ACoS than its first-order margin suggests, and without an LTV number you have no way to know which of your products that describes.

The simple version: average order value multiplied by average orders per customer over your chosen window. The honest version is harder, because the inputs require user-level purchase data that Seller Central doesn't expose. You need every customer grouped by their first-purchase month, then their cumulative orders tracked forward, which is exactly what a cohort analysis produces. On Amazon that user-level view comes through Amazon Marketing Cloud, a data clean room that returns privacy-safe, aggregated results rather than individual shopper identities. The dashboard above is that calculation done for you: cumulative orders, units, and GMV per customer, by cohort, with blended LTV checkpoints at first order, month 3, month 6, and month 9.

There's no universal benchmark worth trusting. A supplement brand and a power-tool brand have structurally different repeat curves, and a “good” rate for one would be alarming for the other. The more useful question is directional: is your repeat rate improving cohort over cohort, or slipping? That's a question a single blended percentage can't answer, because strong acquisition months mask weakening retention underneath. Compare this month's cohort to the same checkpoint in older cohorts and the trend is unambiguous.

The Brand Analytics Repeat Purchase Behavior report shows orders versus unique customers per product over a selected period. It's useful for spotting which ASINs get repurchased at all, but it's a blended total: it can't tell you when customers come back, how a given month's new customers behave over their following year, or whether retention is trending up or down across acquisition months. Cohort analysis adds the time dimension. Customers are grouped by their new-to-brand month and tracked forward, so you see the shape of repeat behavior, not just its existence.

Break-even ACoS is the highest ACoS a product can run before an ad-attributed order loses money. Most sellers calculate it from first-order margin, which is the conservative version: it treats every customer as a one-time buyer. Cohort LTV gives you the honest version. If the average customer in a cohort is worth 1.8x their first order by month 6, the ACoS that product can carry is meaningfully higher than the dashboard number, because the campaign is buying a customer, not an order. That's the practical payoff of this analysis: launch and defense campaigns get judged against the value they build, and harvest campaigns against the margin they protect, instead of every campaign answering to the same first-order math.

Read a cohort's orders-per-customer row and the gaps between increments show your purchase cadence: how long the average customer waits between orders. If customers who reorder do it around day 45, a remarketing audience built on a 30-to-60-day window reaches them while the decision is live, and one built on a generic 90-day window mostly pays to reach people who already came back on their own. The same logic sets your Subscribe & Save push: products whose cohorts show steady reorder rhythm are the ones worth converting to subscriptions.

The cohort table is the arbiter. If young cohorts retain as well as old ones, your base is healthy and the constraint is acquisition volume: spend forward. If each new cohort's month-3 checkpoint lands below the last one's, more acquisition spend is filling a leaking bucket, and the higher-return move is fixing what's eroding repeat behavior first. Without cohorting, this decision gets made on blended numbers that can't distinguish the two situations.

A cohort can't have 9-month data until it's 9 months old. The most recent cohorts will always show fewer filled-in months than the older ones. That's expected, not missing data.

No. This is a real, live dashboard, but it's running on a sample Trellis account, not yours. If you want to see these same questions answered with your own numbers, that's what the free report request above is for.

As a one-off, it's a snapshot. You'd rerun the analysis whenever you wanted a fresh read. On Qore, the same analysis runs on a recurring schedule, so you're looking at a standing report instead of remembering to pull one. Qore is in open beta; you can sign up at qore.gotrellis.com/signup.

GMV is total revenue for the cohort at that month. Orders per Customer is how many separate purchases the average customer has made by then. Units per Customer is how many items, which can climb faster than orders if customers are buying multiples per order over time.

One Operator Across Every Channel You Sell On

Qore already runs the recurring work across your ad accounts: the checks, the analysis, the staged actions.
The store joins that same layer, so a catalog audit or a pre-sale price pass becomes a skill that runs on a
cadence and lands in your queue, instead of a task that gets scheduled and quietly dropped.

Qore already runs the recurring work across your ad accounts: the checks, the analysis, the staged actions. The store joins that same layer, so a catalog audit or a pre-sale price pass becomes a skill that runs on a cadence and lands in your queue, instead of a task that gets scheduled and quietly dropped.

Weekly catalog audit
Pre-sale compare-at staging
Amazon, Walmart, Google, Shopify, TikTok
MCP connection across data and channels
Your operating standard, documented and running
Weekly catalog audit, on schedule
Inspectable logic, not a black box
Every run logged and reviewable
Skills published once, used team-wide
Amazon and Shopify product performance comparison
Weekly catalog audit
Pre-sale compare-at staging
New product SEO pass
Store purchase data to Google and TikTok audiences
Amazon and Shopify product performance comparison
Learn More